Bar Graphs and Pie Charts are two of the most common methods used for representing data visually. They make complex numerical information easy to understand at a glance. While bar graphs are effective for comparing values between categories, pie charts are best suited for showing proportions of a whole. Both are widely used in statistics, business, research, and everyday problem-solving.
1. Bar Graphs
A bar graph (or bar chart) is one of the most commonly used methods for representing data visually. It uses rectangular bars to display information. The length or height of each bar is proportional to the value or quantity it represents.
Bar graphs are simple, easy to understand, and very effective for comparing data across categories.
Key Features of Bar Graphs:
- Bars can be drawn vertically (upward) or horizontally (sideways).
- All bars have the same width, but their heights/lengths are different according to the data values.
- There must be equal spacing between the bars so that the comparison is clear.
- One axis (commonly the x-axis) shows categories while the other axis (y-axis) shows values.
- Colors or patterns can be used to make the bars more visually distinct.
Uses of Bar Graphs:
- To compare different categories (e.g., sales in different regions).
- To show growth or decline over time (e.g., population growth over years).
- To represent survey results, statistical data, and business performance.
- Widely used in economics, marketing, research, and education.
Example of a Bar Graph:
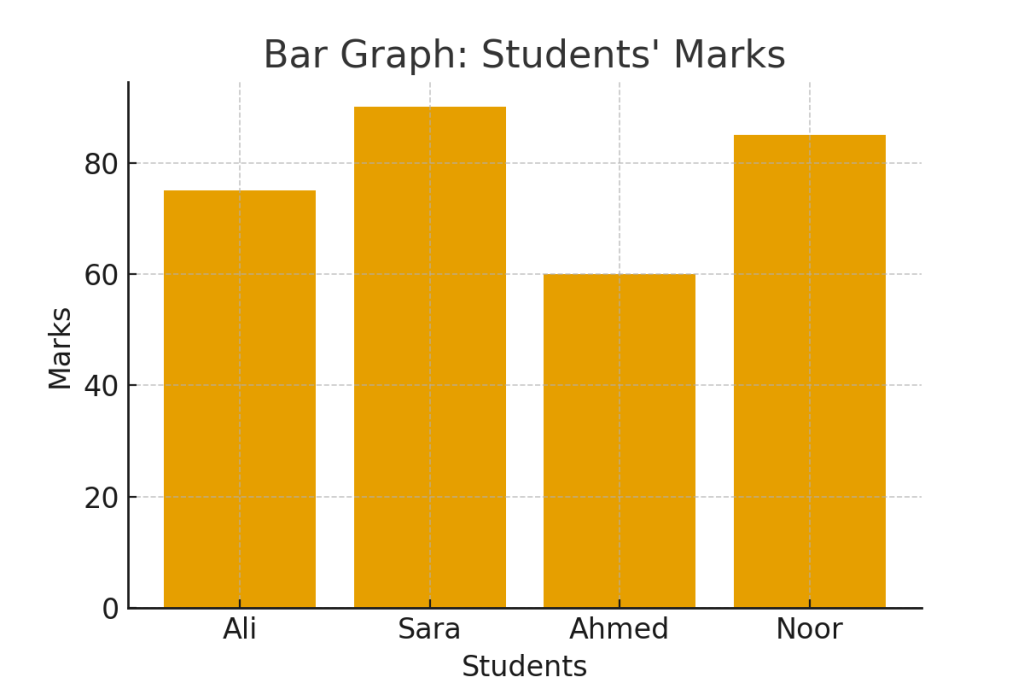
Suppose the marks of students in a class are recorded as follows:
- Ali → 75 marks
- Sara → 90 marks
- Ahmed → 60 marks
- Noor → 85 marks
In this case:
- The X-axis will represent the students’ names.
- The Y-axis will represent the marks obtained.
- Each student’s marks are shown using a bar.
The taller the bar, the higher the marks.

2. Pie Charts
A pie chart is a circular diagram that is divided into slices (sectors). Each slice of the pie represents a proportion of the total data. The size of the slice is proportional to the quantity or percentage it represents.
Pie charts are excellent for showing how a whole is divided into parts.
Key Features of Pie Charts:
- The entire circle represents 100% or 360°.
- Each slice of the circle shows a category’s percentage of the whole.
- Different colors or patterns are used to differentiate slices.
- Best suited for percentage distribution rather than raw numbers.
Formula for Calculating Slice Angle:
Angle of sector=Value of itemTotal Value×360°\text{Angle of sector} = \frac{\text{Value of item}}{\text{Total Value}} \times 360°Angle of sector=Total ValueValue of item×360°
Uses of Pie Charts:
- To show proportions and percentages of a whole.
- To represent budget spending, market shares, population distribution, etc.
- Useful when comparing the contribution of each category to the total.
- Easy for viewers to quickly understand distribution visually.
Example of a Pie Chart:
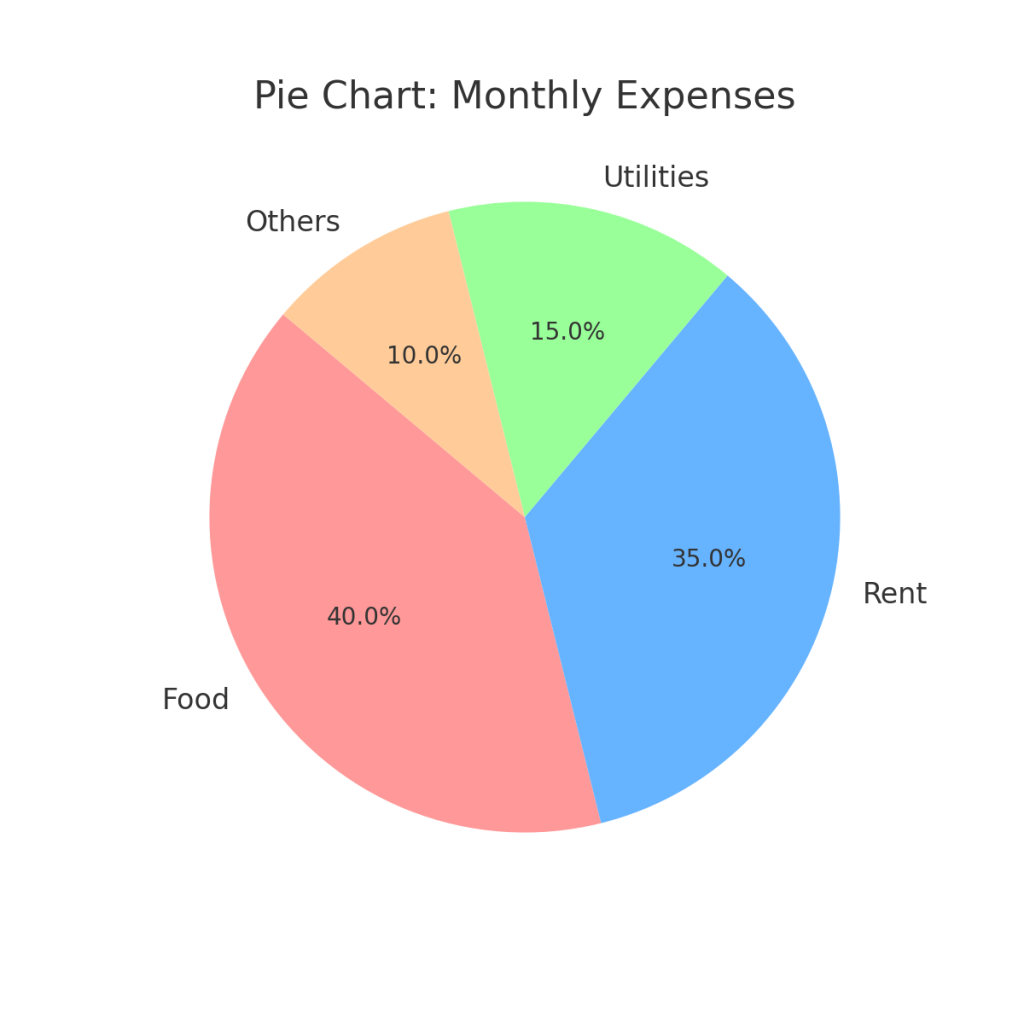
Suppose monthly expenses of a person are Rs. 20,000 divided into:
- Food = Rs. 8,000
- Rent = Rs. 7,000
- Utilities = Rs. 3,000
- Others = Rs. 2,000
Now calculating the sector angles:
- Food: (8000 ÷ 20000) × 360 = 144°
- Rent: (7000 ÷ 20000) × 360 = 126°
- Utilities: (3000 ÷ 20000) × 360 = 54°
- Others: (2000 ÷ 20000) × 360 = 36°
Thus, the whole circle (360°) is divided into four slices showing how money is spent.

Summary (Comparison for Bar Graphs and Pie Charts):
- Bar Graphs → Best for comparing values between categories (e.g., student marks, sales in different years).
- Pie Charts → Best for showing percentage distribution of a whole (e.g., budget, population, expenses).

