Computer Graphics Solved Past Papers

Bar Graphs and Pie Charts

Bar Graphs and Pie Charts

Bar Graphs and Pie Charts are two of the most common methods used for representing data visually. They make complex numerical information easy to understand at a glance. While bar graphs are effective for comparing values between categories, pie charts are best suited for showing proportions of a whole. Both are widely used in statistics, business, research, and everyday problem-solving.

1. Bar Graphs

A bar graph (or bar chart) is one of the most commonly used methods for representing data visually. It uses rectangular bars to display information. The length or height of each bar is proportional to the value or quantity it represents.

Bar graphs are simple, easy to understand, and very effective for comparing data across categories.

Key Features of Bar Graphs:

  • Bars can be drawn vertically (upward) or horizontally (sideways).
  • All bars have the same width, but their heights/lengths are different according to the data values.
  • There must be equal spacing between the bars so that the comparison is clear.
  • One axis (commonly the x-axis) shows categories while the other axis (y-axis) shows values.
  • Colors or patterns can be used to make the bars more visually distinct.

Uses of Bar Graphs:

  • To compare different categories (e.g., sales in different regions).
  • To show growth or decline over time (e.g., population growth over years).
  • To represent survey results, statistical data, and business performance.
  • Widely used in economics, marketing, research, and education.

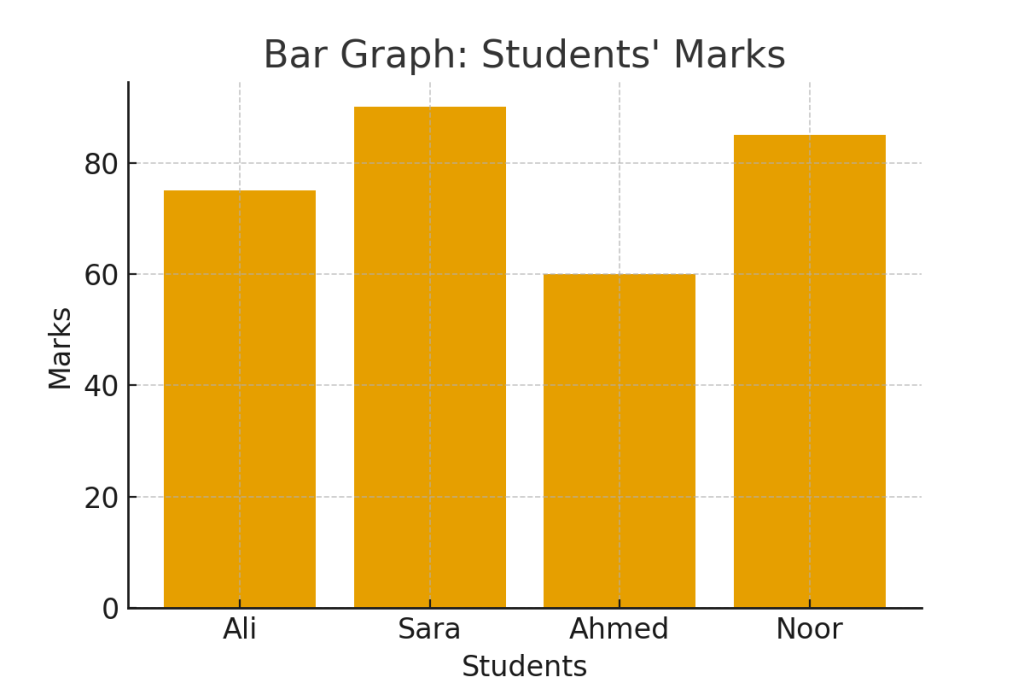
Example of a Bar Graph:

Suppose the marks of students in a class are recorded as follows:

  • Ali → 75 marks
  • Sara → 90 marks
  • Ahmed → 60 marks
  • Noor → 85 marks

In this case:

  • The X-axis will represent the students’ names.
  • The Y-axis will represent the marks obtained.
  • Each student’s marks are shown using a bar.
    The taller the bar, the higher the marks.

2. Pie Charts

A pie chart is a circular diagram that is divided into slices (sectors). Each slice of the pie represents a proportion of the total data. The size of the slice is proportional to the quantity or percentage it represents.

Pie charts are excellent for showing how a whole is divided into parts.

Key Features of Pie Charts:

  • The entire circle represents 100% or 360°.
  • Each slice of the circle shows a category’s percentage of the whole.
  • Different colors or patterns are used to differentiate slices.
  • Best suited for percentage distribution rather than raw numbers.

Formula for Calculating Slice Angle:

Angle of sector=Value of itemTotal Value×360°\text{Angle of sector} = \frac{\text{Value of item}}{\text{Total Value}} \times 360°Angle of sector=Total ValueValue of item​×360°

Uses of Pie Charts:

  • To show proportions and percentages of a whole.
  • To represent budget spending, market shares, population distribution, etc.
  • Useful when comparing the contribution of each category to the total.
  • Easy for viewers to quickly understand distribution visually.

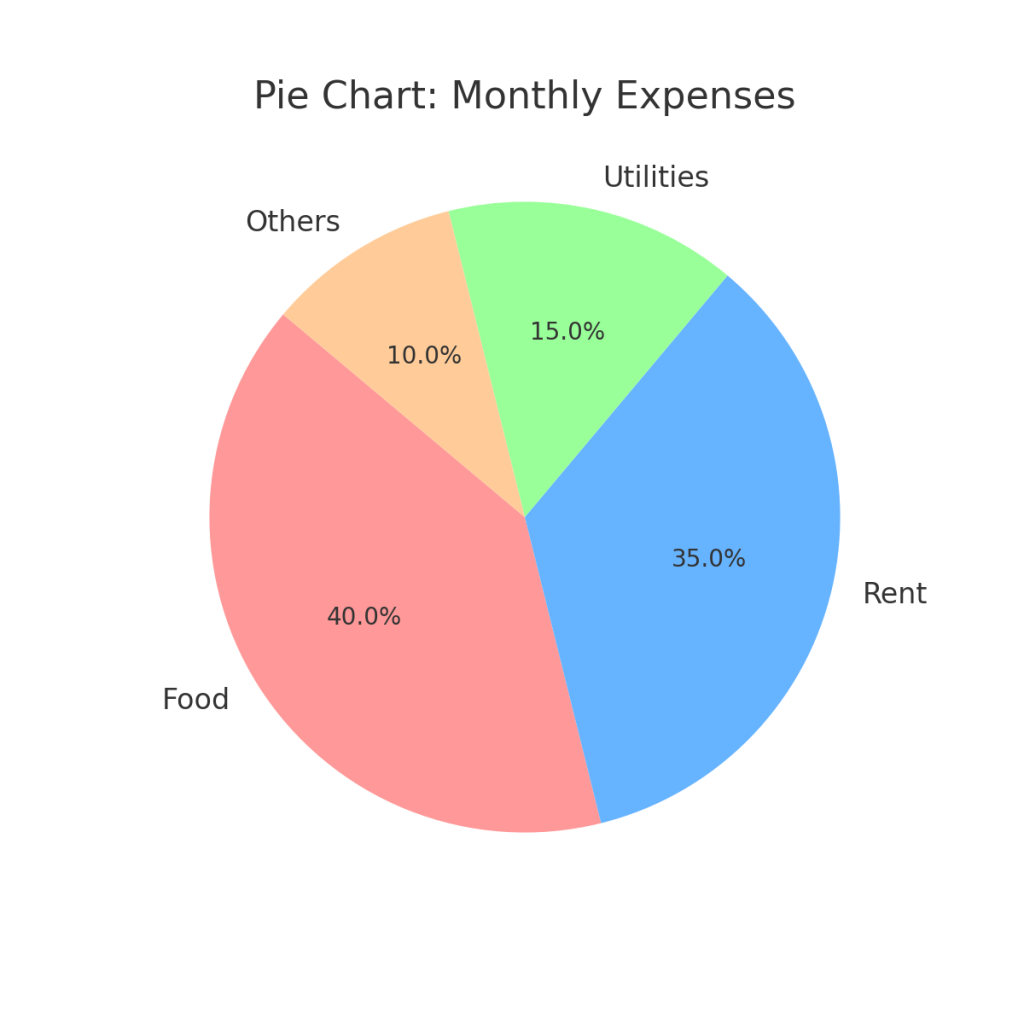
Example of a Pie Chart:

Suppose monthly expenses of a person are Rs. 20,000 divided into:

  • Food = Rs. 8,000
  • Rent = Rs. 7,000
  • Utilities = Rs. 3,000
  • Others = Rs. 2,000

Now calculating the sector angles:

  • Food: (8000 ÷ 20000) × 360 = 144°
  • Rent: (7000 ÷ 20000) × 360 = 126°
  • Utilities: (3000 ÷ 20000) × 360 = 54°
  • Others: (2000 ÷ 20000) × 360 = 36°

Thus, the whole circle (360°) is divided into four slices showing how money is spent.

Summary (Comparison for Bar Graphs and Pie Charts):

  • Bar Graphs → Best for comparing values between categories (e.g., student marks, sales in different years).
  • Pie Charts → Best for showing percentage distribution of a whole (e.g., budget, population, expenses).

Bar Graphs and Pie Charts Read More »

monochromatic display monitor

Discuss the working principles of monochromatic display monitor.

A monochromatic display monitor is a type of screen that shows images in a single color (commonly black and white, or sometimes green/amber on black).

These monitors were widely used in the early days of computers before color displays became common. They are still useful in certain applications like oscilloscopes, medical devices, and basic terminals where clarity is more important than color.

Basic Working Principle

Cathode Ray Tube (CRT) Technology

  • Traditional monochrome monitors were based on CRT technology.
  • Inside the CRT, an electron gun emits a beam of electrons.
  • The beam is directed towards the inner surface of the screen, which is coated with a phosphor material.
  • When the electrons strike the phosphor coating, it glows, producing visible light.

Phosphor Coating

  • The screen has a uniform layer of phosphor that emits one single color (for example, white, green, or amber).
  • Since there are no different phosphor dots for RGB, the entire screen shows only that one color.

Raster Scanning

  • The electron beam moves across the screen from left to right and top to bottom in a method called raster scanning.
  • When the beam is turned on, it lights up the phosphor (a bright pixel).
  • When the beam is off, the pixel remains dark.
  • This on/off control allows the display of text and graphics.

Intensity Control

  • Brightness is controlled by adjusting the intensity of the electron beam.
  • Unlike color monitors, which use three beams for RGB, a monochrome monitor uses only one electron beam, making it simpler and sharper for text display.

Characteristics of Monochrome Displays

  • High contrast and sharp text compared to early color monitors.
  • Limited to one color, so no ability to show colored graphics.
  • Often used green or amber because they were easier on the eyes than white.
  • Cheaper and simpler design compared to color CRTs.

Applications of Monochromatic Display Monitor

  • Early personal computers (like IBM PCs in the 1980s).
  • Oscilloscopes and lab instruments.
  • Medical and industrial monitoring equipment.
  • Basic terminals for text-based systems.

A monochromatic display monitor works by using a single electron beam in a CRT to excite a uniform phosphor coating on the screen. It produces images in one color through raster scanning and intensity control. While obsolete in modern consumer electronics, these displays were crucial in the development of computer graphics and are still used in specialized equipment.

Discuss the working principles of monochromatic display monitor. Read More »

Computer Graphics

What is Computer Graphics? Define its applications.

Computer Graphics is the branch of computer science that deals with the creation, storage, manipulation, and representation of visual images using computers.
It converts data into pictorial or graphical form so that it becomes easier to understand, analyze, and interact with.

In simple words, Computer Graphics is the technology that enables us to create images, animations, and simulations on a computer screen.

Applications of Computer Graphics

User Interfaces (GUI)

  • All modern operating systems (Windows, macOS, Linux) use graphics-based user interfaces for better interaction.
  • Icons, menus, and windows are examples of computer graphics in GUI.

Entertainment and Media

  • Used in movies, video games, cartoons, and animations.
  • Special effects (VFX) and 3D animations are developed using graphics software.

Education and Training

  • Interactive learning tools, simulations, and tutorials use graphics for better visualization.
  • Example: Flight simulators for pilot training.

Engineering and Design (CAD/CAM)

  • Engineers and architects use computer graphics for designing buildings, bridges, automobiles, and machinery.
  • CAD (Computer-Aided Design) and CAM (Computer-Aided Manufacturing) rely heavily on graphics.

Medical Applications

  • Used for visualizing complex medical data such as CT scans, MRIs, and 3D modeling of organs.
  • Helps in surgeries and medical research.

Scientific Visualization

  • Large data sets (like weather patterns, molecular structures, or space research) are converted into visual models.
  • Helps researchers to understand complex scientific problems.

Business and Advertising

  • Charts, graphs, and presentations are created using graphics to simplify data.
  • Advertisements, posters, and digital marketing also rely on computer graphics.

Virtual Reality and Augmented Reality

  • VR/AR applications use computer graphics to create immersive experiences.
  • Widely applied in gaming, education, and real estate.

Computer Graphics makes computers more interactive, attractive, and meaningful by presenting information visually. Its applications range from daily user interfaces to highly advanced fields like medicine, engineering, and entertainment.

What is Computer Graphics? Define its applications. Read More »

error: Content is protected !!
Scroll to Top